Help: User's Guide: Acquisition Forecaster
Acquisition Forecaster is a tool which provides users with the ability to predict when a satellite has the ability to image a region of interest. Acquisition Forecaster models satellite orbits using Two Line Element (TLE) data, and it divides the swath into footprint segments using the width of the field of view (fovc) and the off-nadir pointing angle of each mission/instrument mode. TLE data used to forecast missions is imported daily into COVE from data provided by Space-Track.org.
Acquisition Forecaster can predict up to three months into the future for active missions with TLE data. Custom missions may be created and used in Acquisition Forecaster to predict notional missions up to three months into the future. TLE data will be generated for custom missions. See Custom Missions section for more information.
Acquisition Forecaster tool can be launched from the COVE home page by selecting the Launch COVE button, or from the Tools menu in the title menu bar.
Initiating a task
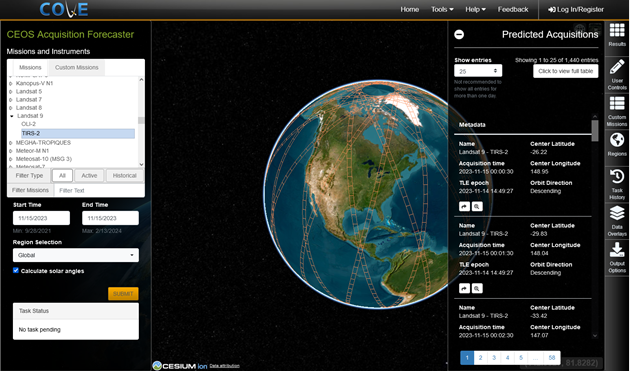
In Acquisition Forecaster in the Missions and Instruments panel, users may select one or more instruments/instrument modes from the missions and/or custom missions tabs. Users may click on a mission or custom mission name to show the instruments/instrument modes available for the mission/custom mission. See Multiselect Menus section for more information on using the collapsible multiselect menus in COVE.
Missions available in the Missions tab in the Missions and Instruments panel in Acquisition Forecaster are limited to missions and instrument modes which have been added to the COVE database and missions for which TLE data exists. Requests may be made to the COVE development team to add additional missions through the Feedback page.
Users may create notional or proposed missions/instruments from the custom missions panel by supplying parameters which will allow COVE to generate a TLE for the custom mission when an Acquisition Forecaster task is submitted. The custom missions panel may be accessed by clicking on the Custom Missions tab on the right side of the Acquisition Forecaster tool. Once created, custom missions will be available in the Custom Missions tab in the Missions and Instruments panel.
Users may enter a start time and end time. Start time defaults to the current date, and end time defaults to tomorrow's date. The start time entered should be no earlier than the most recent satellite mission launch date of the mission/instrument modes selected in the missions tab. The minimum start date allowed will be displayed under the start time field once a mission/instrument mode has been selected. The end time entered should be no later than 90 days from most recent TLE epoch for active missions, 90 days from the current date for custom missions, or no later than the decommissioned date for inactive missions. TLE data is updated daily. The maximum end date allowed will be displayed under the end date field once a mission/instrument mode has been selected.
Users may select a region of interest from the region selection menu. Acquisition Forecaster will zoom in to the region of interest on the map or zoom out to show the full globe if the region Global is selected.
Users may select the calculate solar angles checkbox to include solar elevation, solar azimuth, and solar zenith angles in metadata for all predicted scene results for the task. If users do not select calculate solar angles, the results may still have some scenes with solar angles calculated if the scenes were previously cached by COVE for another task.
Users may initiate an Acquisition Forecaster task by selecting at least one instrument/instrument mode from the missions and/or custom missions tabs, entering a start time and end time, selecting a region from the region selection menu, optionally selecting the calculate solar angles checkbox, and lastly selecting the Submit button.
Once an Acquisition Forecaster task is initiated, the status of the task will be displayed in the Task Status block. The status will show "No task pending" if Acquisition Forecaster is not currently waiting for the results of an initiated task. The status will show "Evaluating request..." while validating user entered parameters, "Please wait while your coverage is computed." while the task is processing, and "Gathering acquisitions..." while retrieving the results. Once the task has completed successfully, the results panel will open on the right side of Acquisition Forecaster and the forecasted scenes will be drawn on the map for the region of interest.
Once a task has been submitted in Acquisition Forecaster, users may select the Cancel button while a task is running. Although be aware that even though the canceled task will not be listed in the Task History panel, the task will continue to run in the background where the data will be cached. If users choose to leave the Acquisition Forecaster tool while a task is running without canceling the task, users may later load the results of the completed task from the Task History. If users wish to return to a task later, they should be logged in to their COVE user account prior to submitting the task or while loading the task from task history. Only tasks which completed without error will be listed in the Task History panel.
Viewing the results of a task
When an active Acquisition Forecaster task has completed or an Acquisition Forecaster task is loaded from task history, the resulting footprints for the swath area in the region of interest will be drawn on the map. A list of individual results for each forecasted scene (forecasted acquisition) will be listed in the results tab on right side of the Acquisition Forecaster tool.
Users are able to view individual forecasted scene details such as the mission-instrument-mode name, estimated acquisition time, TLE epoch time, center latitude/longitude of the scene footprint, and the scene lighting (day or night). Forecasted scene details can be viewed in multiple ways.
- By hovering over a footprint on the map, the corresponding forecasted scene will be highlighted in the results list.
- By hovering over a forecasted scene in the results list, the corresponding footprint will be highlighted on the map. Clicking on a footprint on the map, the forecasted scene details will be displayed in a popup.
- By clicking on the arrow button on an individual scene in the results list, the forecasted scene details will be displayed in a popup.
- By clicking on the magnifying glass button for an individual scene in the results list, Acquisition Forecaster will zoom in to the footprint on the map. Users may then click on the footprint to view the details popup.
- By clicking on the "Click to view full table" button at the top of the results panel, a paginated list of forecasted scenes will be displayed in a popup where users may choose to show 25, 50, 100, 250 entries per page.
Results are shown in a paginated list in the Results panel on the right side of the Acquisition Forecaster tool. Users may choose to display entries in the results list by 25, 50, 100, or 250 entries per page. However, 25 is recommended for quicker transitions in highlighting footprints and scenes.
There is a maximum limit of 25000 scenes generated in the Acquisition Forecaster tool for a task. If a task is reaching this limit, users may choose to reduce the number of instrument/instrument modes, the time span, or reduce the region of interest from Global to a smaller region. Subsequently, users may submit a new task.
Adjusting map results with user controls
Users may choose to adjust the results on the map by changing user options available in the User Controls panel on the right side of the Acquisition Forecaster tool.
Users may change the color of each mode by:
- In the legend, clicking on the color block next to mode number, and choosing a color from the colorpicker. The mode number is an arbitrary sequential index value.
- Clicking on the pencil icon and changing the hex color code. Click the Validate Color Scale button to return to the legend and apply the color change.
- Changing the color scale from the drop-down menu. A limited number of color scales are available. Yellow to red, yellow to green, red to green, blue to green, and spectral. The default color scale is red to green. For one or two modes the color palette shows colors within the color scale. For example, it shows a single selected mode as orange on a red to green color scale. For more than two modes, the color palette will show the outer ranges of the color scale.
Users may change the transparency of all modes by changing the transparency value. In Acquisition Forecaster, transparency defaults to 0.01. The valid range for transparency is 0.01 to 0.99.
Users may select an orbit direction from a drop-down list. Options available are All, Ascending, and Descending. If ascending is selected, scenes shown in the results will be filtered by scenes with an ascending orbit direction. If descending is selected, scenes shown in the results will be filtered by scenes with a descending orbit direction. If all is selected, all scenes will be shown in the results regardless of orbit direction. Ascending orbit direction will be selected by default.
Users may select a swath type from a drop-down list. Options available are All, Footprints, and Nadir Line. If all is selected, forecasted footprints and the nadir track will be shown on the map. If footprints is selected only the forecasted footprints will be shown. If nadir line is selected, only the nadir track will be shown. The nadir line represents the projected mission orbit. Footprints is selected by default.
Creating and managing custom missions
Users may create and manage custom missions and custom instruments from the right-side Custom Missions panel in Acquisition Forecaster, Coincident Calculator, and Revisits Calculator tools. See the Custom Missions section for more information on creating and managing custom missions.
Creating and managing user created regions
Users may create and manage user defined regions from the right-side Regions panel in Acquisition Forecaster, Coincident Calculator, Coverage Analyzer, Revisits Calculator, and Data Browser tools. See the Regions section for more information on creating and managing regions.
Managing and loading completed tasks from task history
A task history may be accessed from the right-side menu tab in the Acquisition Forecaster tool. The task history is a list of Acquisition Forecaster tasks, and the list is limited to successfully completed tasks initiated during the current browser session for users not logged into a COVE user account or initiated while users are logged into a COVE user account. Each task description includes a title (mode: instrument: mission: region from start year-end year), mode selection (mission: mode-instrument-mission), date range (start date, end date), and region selection for the task.
Acquisition Forecaster tasks are a shown in a paginated list. Users may choose to display entries in the results list by 25, 50, 100, or 250 entries per page.
The search capability allows users to search for the sequence of characters in any of the parameters of the task history.
To load a task from the task history, click on the "Load this task" button located directly under the task details.
To delete a task from the task history, click on the red trashcan icon located directly under the task details.
Applying data overlays
Data overlays may be accessed from the right-side menu tab in Acquisition Forecaster tool. Data overlays is not dependent on any forecasted scene data from Acquisition Forecaster.
Users may choose to show/hide political borders on the map by selecting/deselecting the corresponding checkbox.
Users may choose to show/hide a latitude/longitude grid on the map by selecting/deselecting the corresponding checkbox.
Users may choose other data overlay options from a drop-down menu. These drop-down menu options include:
- None: No data overlay
-
Elevation: The Terra Advanced Spaceborne Thermal Emission and Reflection Radiometer
(ASTER) Global Digital Elevation Model (GDEM) Version 3 (ASTGTM) provides a global digital
elevation model (DEM) of land areas on Earth.
Source: https://asterweb.jpl.nasa.gov/gdem.asp -
GlobCover: Global Land Cover overlay covers the period December 2004 - June
2006 and was derived by an automatic and regionally tuned classification of a MERIS
full resolution surface reflectance time series. GlobCover is a European Space Agency
initiative. Source: http://due.esrin.esa.int/page_globcover.php -
Köppen-Geiger: Climate classification overlay.
Source: http://koeppen-geiger.vu-wien.ac.at/present.htm - Landsat WRS: Landsat Worldwide Reference System (WRS) overlay mapping path/row footprints. Source: overlay generated from Landsat WRS path/row mapping data within COVE.
-
MODIS Land Cover: The Terra Moderate Resolution Imaging Spectroradiometer
(MODIS) Vegetation Indices 16-Day (MOD13C1) Version 6.1 product provides a
Vegetation Index (VI) value at a per pixel basis.
Source: https://lpdaac.usgs.gov/products/mod13c1v061/ - Revisit Performance (L7, L8, S2A): Days until revisit overlay includes Landsat 7, Landsat 8, and Sentinel-2A
- Revisit Performance (L7, L8, S2A, S2B): Days until revisit overlay includes Landsat 7, Landsat 8, Sentinel-2A, and Sentinel-2B
- Revisit Performance (L8, S2A, S2B): Days until revisit overlay includes Landsat 8, Sentinel-2A, and Sentinel-2B
- S2Tiling: Sentinel-2 tiling grid. Source: overlay generated from Sentinel-2 granule mapping data within COVE.
Using output options
The forecasted map can be exported and downloaded using the options listed below. Supported formats include PNG, and CSV.
- Download PNG: PNG (portable network graphics) is a common compressed raster graphics file format. PGN output images will contain the current map view.
- Download Abbreviated CSV: CSV (comma separated values) is a common standard spreadsheet format. Output CSV files contain headers and a list of all unique scenes. This will remove any duplicate or overlapping coverages, providing a single list of all acquisitions from this task. CSV columns may include mission (mission-instrument-mode name), acquisition time, TLE epoch, center_latitude, center_longitude, and orbit_direction.
- Download Full CSV: CSV (comma separated values) is a common standard spreadsheet format. Output CSV files contain headers and a list of all unique scenes. This will remove any duplicate or overlapping coverages, providing a single list of all acquisitions from this task. CSV columns may include mission (mission-instrument-mode name), acquisition time, TLE epoch, center_latitude, center_longitude, orbit_direction, sun_elevation, sun_zenith, sun_azimuth, and scene_coords.