Help: User's Guide: Data Browser
Data Browser is a tool that allows users to view the satellite image archives from multiple CEOS missions. Data Browser plots the footprint for scenes within a region of interest for a specific time span. Scene data is extracted from satellite metadata imported into COVE from data providers for select satellites.
Data Browser tool can be launched from the Tools menu in the title menu bar.
Initiating a task
In Data Browser in the Missions and Instruments panel, users may choose from a small selection of missions. Users may click on a mission name to show the instrument modes available for the mission. Users may select one or more instrument modes from the missions list.
Missions available in Data Browser are limited to missions which have been integrated into COVE in an automated process to acquire datasets from satellite data providers. Scene data is submitted to data providers. The COVE automated acquisitions process runs daily and acquires all scene data submitted within the last thirty days for Sentinel-1 and Sentinel-2 missions and five days for all other missions.
Users may enter a start time and end time. The start time entered should be no earlier than the most recent satellite mission launch date of the mission/instrument modes selected in the missions tab. The minimum start date allowed will be displayed under the start time field once a mission/instrument mode has been selected. The end time entered should be no later than the current date for active missions or no later than the decommissioned date for inactive missions. The maximum end date allowed will be displayed under the end date field once a mission/instrument mode has been selected.
Users may select a region of interest from the region selection menu. Data Browser will zoom in to the region of interest on the map or zoom out to show the full globe if the region Global is selected.
Filter options in the missions and instruments panel will vary depending on the missions selected in the missions list. Refer to the filter options in the section below Adjusting map results with user controls .
Users may initiate a Data Browser task by selecting at least one instrument mode from the missions list, entering a start time and end time, selecting a region from the region selection menu, selecting optional filtering options, and lastly selecting the Submit button.
Once a Data Browser task is initiated, the status of the task will be displayed in the Task Status block. The status will show "No task pending" if Data Browser is not currently waiting for the results of an initiated task. The status will show "Evaluating request..." while validating user entered parameters, and "Please wait while your coverage is computed." while the task is processing. Once the task has completed successfully, acquisition footprints will be drawn on the map and the query results panel will open in the Data Browser tool.
Once a task has been submitted in Data Browser, users may select the Cancel button while a task is running. Although be aware that even though the canceled task will not be listed in the Task History panel, the task will continue to run in the background where the data will be cached. If users choose to leave the Data Browser tool while a task is running without canceling the task, users may later load the results of the completed task from the Task History. If users wish to return to a task later, users should be logged in to their COVE user account prior to submitting the task or while loading the task from task history. Only tasks which completed without error will be listed in the Task History panel.
All tasks in the Task History in Data Browser are deleted from COVE after one week to clear cached data.
Viewing the results of a task
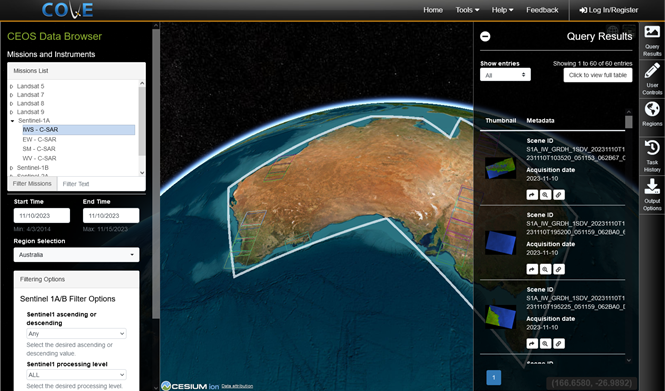
When an active Data Browser task has completed or a Data Browser task is loaded from task history, a subset of the resulting footprints for the scenes in the region of interest will be drawn on the map. A list of individual query results for each scene acquisition will be listed in the Query Results panel on right side of the Data Browser tool. The subset of results drawn on the map is limited to the scenes listed in the query results for each page of results.
Users may view individual scene metadata. Scene acquisition details can be viewed in multiple ways.
- By hovering over a footprint on the map, the corresponding scene acquisition will be highlighted in the results list.
- By hovering over a scene acquisition in the results list, the corresponding footprint will be highlighted on the map. If users click on a footprint on the map, the scene acquisition details will be displayed in a popup.
- By clicking on the arrow button on an individual scene acquisition in the results list, the scene metadata will be displayed in a popup.
- By clicking on the magnifying glass button for an individual scene in the results list, Data Browser will zoom in to the footprint on the map. Users may then click on the footprint to view the scene metadata popup.
- By clicking on the Click to view full table button at the top of the query results panel, a paginated list of scene acquisitions will be displayed in a popup where users may choose to show All, 25, 50, 100, 250 entries per page.
Query results are shown in a paginated list. Users may choose to display entries in the query results list by All, 25, 50, 100, or 250 entries per page. All footprints are shown by default. However, 25 may allow for quicker transitions in highlighting footprints and scenes.
There is a maximum limit of 25000 scenes loaded in the Data Browser tool for a task. If a task is reaching this limit, they user may choose to reduce the number of instrument/instrument modes, the time span, or reduce the region of interest from Global to a smaller region, change filtering options, and submit a new task.
The Sentinel-2A & 2B mission is a combined dataset (SENTINEL_2A) from USGS's Earth Explorer API. The only way to distinguish Sentinel-2A scenes from Sentinel-2B scenes when viewing scene details in Data Browser is to look at the thumbnail URL. The thumbnail URL for Sentinel-2A will contain "s2a", and Sentinel-2B will contain "s2b". The order URL reflects the dataset name instead of the mission name.
Adjusting map results with user controls
Users may choose to adjust the query results by changing filter options available in the User Controls panel on the right side of the Data Browser tool. Filter options in user controls will vary depending on the missions selected for the task currently loaded into results. A new Data Browser task is submitted once users select the "Submit" button to apply the filter options to the original task results. Task details in the Task History will also include any filter options applied. Filter options for each mission are:
-
Landsat (5, 7, 8, 9)
- Cloud cover percentage: Maximum cloud cover percentage allowed in a scene
- Landsat day or night indicator: Options include any, day, and night (scene lighting)
-
Sentinel-1A/1B
- Sentinel1 ascending or descending: Options include any, ascending, and descending (orbit direction)
- Sentinel1 processing level: Options include all, GRD (Ground Range Detected), and SLC (Single Look Complex).
-
Sentinel-2A/2B
- Cloud cover percentage: Maximum cloud cover percentage allowed in a scene
Creating and managing user created regions
Users may create and manage user defined regions from the right-side Regions panel in Acquisition Forecaster, Coincident Calculator, Coverage Analyzer, Revisits Calculator, and Data Browser tools. See the Regions section for more information on creating and managing regions.
Managing and loading completed tasks from task history
A task history may be accessed from the right-side menu tab in the Data Browser tool. The task history is a list of Data Browser tasks, and the list is limited to successfully completed tasks initiated during the current browser session for users not logged into a COVE user account or initiated while users are logged into a COVE user account. Each task description includes a title (mode - instrument - mission - region from start year-end year), mode selection (mission: mode-instrument-mission), date range (start date, end date), region selection for the task, and if the task was pushed from Coverage Analyzer, will include discretization id.
Data Browser tasks are shown in a paginated list. Users may choose to display entries in the results list by 25, 50, 100, or 250 entries per page.
The search capability allows users to search for the sequence of characters in any of the parameters of the task history.
To load a task from the task history, click on the "Load this task" button located directly under the task details.
To delete a task from the task history, click on the red trashcan icon located directly under the task details.
Using output options
Users may select from the options listed below. Supported formats include PNG (portable network graphics), and CSV (comma separated values).
- Download PNG: PNG is a common compressed raster graphics file format. PGN output images will contain the current map view.
- Download Abbreviated CSV : Output CSV files contain headers and a list of all unique scenes. This will remove any duplicate or overlapping coverages, providing a single list of all acquisitions from this task. The abbreviated CSV version contains an abbreviated metadata set. The CSV columns include mission, name, acquisition_date, browse_url, order_url, start_time, stop_time, center_latitude, and center_longitude.
- Download Full CSV: Output CSV files contain headers and a list of all unique scenes. This will remove any duplicate or overlapping coverages, providing a single list of all acquisitions from this task. The full CS version will contain a full metadata set. The CSV columns may include mission, name, acquisition_date, browse_url, order_url, start_time, stop_time, center_latitude, center_longitude, orbit_direction, path, frame, orbit_number, processing_level, row, day_or_night, cloud_cover, sensor, sun_elevation, sun_azimuth, granule_name, and scene_coords.
- Open in Coverage Analyzer: Pushing a task to the Coverage Analyzer allows users to easily see a coverage map of all acquisitions covering the selected region. Please note that the default coverage map is of an unfiltered query and any desired filters must be applied in the user controls panel. The default discretization method for Landsat 5, 7, and 8 missions will be Landsat WRS discretization without overlap (1:1). For all other missions, the default discretization size used will be 1.0 degrees.