Help: User's Guide: Revisits Calculator
Revisits Calculator is a tool which allows users to analyze estimated total coverage and satellite revisits for a discretized region of interest within a span of time. The Revisits Calculator tool utilizes orbit modeling capability of Acquisition Forecaster, generates a discretized area covering a region of interest, and determines the coincidence of forecasted scene acquisitions within each discretized block. The coincidence of forecasted scenes is determined by the intersection of the footprint of the discretized block and the footprint of the forecasted scene.
Revisits Calculator tool can be launched from the Tools menu in the title menu bar.
Initiating a task
In Revisits Calculator in the Missions and Instruments panel, users may select one or more instruments/instrument modes from the missions and/or custom missions tabs. Users may click on a mission or custom mission name to show the instruments/instrument modes available for the mission/custom mission. See Multiselect Menus section for more information on using the collapsible multiselect menus in COVE.
Missions available in the Missions tab in the Missions and Instruments panel in Revisits Calculator are limited to missions and instrument modes which have been added to the COVE database and missions for which TLE data exists. Requests may be made to the COVE development team to add additional missions through the Feedback page.
Users may create notional or proposed missions/instruments from the custom missions panel by supplying parameters which will allow COVE to generate a TLE for the custom mission when a Revisits Calculator task is submitted. The custom missions panel may be accessed by clicking on the Custom Missions tab on the right side of the Revisits Calculator tool. Once created, custom missions will be available in the Custom Missions tab in the Missions and Instruments panel.
Users may enter a start time and end time. Start time defaults to the current date, and end time defaults to tomorrow's date. The start time entered should be no earlier than the most recent satellite mission launch date of the mission/instrument modes selected in the missions tab. The minimum start date allowed will be displayed under the start time field once a mission/instrument mode has been selected. The end time entered should be no later than 90 days from most recent TLE epoch for active missions, 90 days from the current date for custom missions, or no later than the decommissioned date for inactive missions. TLE data is updated daily. The maximum end date allowed will be displayed under the end date field once a mission/instrument mode has been selected.
Users may select a region of interest from the region selection menu. Revisits Calculator will zoom in to the region of interest on the map. Global region is only available for admin users.
Discretization is used to divide a region of interest into blocks. Users may select a discretization method: predefined or user defined discretization. Selecting the predefined discretization method will reveal a drop down of predefined discretization methods: Landsat WRS, S2 Tiling Scheme, 0.10 Degree, 0.25 Degree, 0.5 Degree, or 1 Degree. Revisits Calculator tasks using Landsat WRS or S2 Tiling Scheme discretization methods will include overlap. Selecting the user defined discretization method will reveal the discretization size and units fields. Users may enter a decimal value for discretization size with a minimum possible value of 0.1. Discretization unit may be set to degrees or kilometers. The discretization size is size of the square footprint if each block within the discretized region of interest.
Users may initiate a Revisits Calculator task by selecting at least one instrument/instrument mode from the missions and/or custom missions tabs, entering a start time and end time, selecting a region from the region selection menu, and lastly selecting the Submit button. If tasks with multiple instrument modes are submitted, any intersecting footprints with an acquisition time difference less or equal than two minutes will be counted as one revisit. Otherwise, the intersection of the footprints will be counted as two revisits.
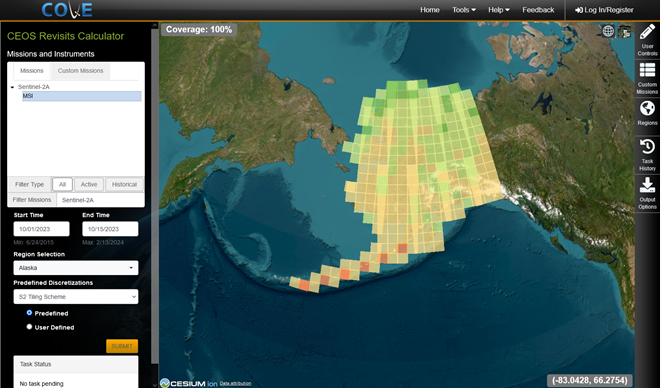
Once a Revisits Calculator task is initiated, the status of the task will be displayed in the Task Status block. The status will show "No task pending" if Revisits Calculator is not currently waiting for the results of an initiated task. The status will show "Evaluating task size..." while validating user entered parameters, "Forecasting acquisitions..." while generating the forecasted scene data, "Discretizing region..." while the region is divided into discretized blocks, and "Generating coincidence... while the task computes the intersection of the footprint of the forecasted scenes and the footprint of the discretized blocks. Once the task has completed successfully, a heatmap of discretized blocks and the total percentage of coverage for the region will be drawn on the map of the Revisits Calculator tool.
Revisits Calculator may return an error notifying the user that the task is too large. Revisits Calculator estimates the number of discretized blocks in a region times the number of days in the date range to determine task size. If a task is too large, a user may choose to increase the discretization size, select a smaller region, or decrease the date range.
Once a task has been submitted in Revisits Calculator, users may select the Cancel button while a task is running. Although be aware that even though the canceled task will not be listed in the Task History panel, the task will continue to run in the background where the data will be cached. If users choose to leave the Revisits Calculator tool while a task is running without canceling the task, users may later load the results of the completed task from the Task History. If users wish to return to a task later, users should be logged in to their COVE user account prior to submitting the task or while loading the task from task history. Only tasks which completed without error will be listed in the Task History panel.
Revisits Calculator tool utilizes the Acquisition Forecaster tool to forecast scenes. Once a Revisits Calculator task completes, users will also find the corresponding task in Task History in Acquisition Forecaster. Users may load the Acquisition Forecaster task from Task History in Acquisition Forecaster or from Output Options in Revisits Calculator.
All tasks in the Task History in Revisits Calculator are deleted from COVE after one week to clear cached data.
Viewing the results of a task
Results from Revisits Calculator will appear in a heatmap of discretized blocks.
The coverage value displayed in the upper left corner of the map is the percentage of forecasted scene coverage for the region of interest. Coverage is calculated by the total number of discretized blocks with at least one revisit divided by the total number of discretized blocks times 100 for the region of interest.
Hovering over a discretized block will show a title and the number of revisits within the discretized block. The title will appear like Title: Region Discretization Longitude -75.0, Latitude -8.5. If no estimated revisits exist within the discretized block, no revisits value will appear. User controls option for revisits time metrics details may also be visible.
Adjusting map results with user controls
Users may choose to adjust the results on the map by changing user options available in the User Controls panel on the right side of the Revisits Calculator tool.
Users may change colors on the heatmap by:
- From the legend, clicking on the color block next to number range of revisits, and choosing a color from the colorpicker.
- Clicking on the pencil icon and changing the hex color code. Users may also adjust the maximum range of the number of ranges assigned to each color. Click the Validate Color Scale button to return to the legend and apply the color change.
- Changing the number of colors used in the color scale. Users may choose from a drop-down list of values ranging from three to nine.
- Changing the color scale from the drop-down menu. A limited number of color scales are available. Yellow to red, yellow to green, red to green, blue to green, and spectral. The default color scale is red to green.
Users may change the transparency of the heatmap by changing the transparency value. In Revisits Calculator, transparency defaults to 0.75. The valid range for transparency is 0.01 to 0.99.
Users may select an orbit direction from a drop-down list. Options available are All, Ascending, and Descending. If ascending is selected, scenes shown in the results will be filtered by scenes with an ascending orbit direction. If descending is selected, scenes shown in the results will be filtered by scenes with a descending orbit direction. If all is selected, all scenes will be shown in the results regardless of orbit direction. Ascending orbit direction will be selected by default.
Users may choose to display revisits time metrics by selecting an option from a drop-down list. The metrics are visible when hovering over a discretized block. If revisits calculated is less than two in a block, no time metric will be displayed in the hover block. Time metrics are calculated based on lapses of time between each revisit. Therefore, if revisits is less than two, elapsed time is zero. Revisits time metrics options are:
- None: Do not display revisits time metrics. Default option.
- Minimum: Calculated as the least estimated time elapsed between distinct acquisition times of forecasted scenes for all revisits between the start and end time of the task. The hover block will include a label like Minimum Time Between Revisits: 22:21:00.
- Maximum: Calculated as the greatest estimated time elapsed between distinct acquisition times of forecasted scenes for all revisits between the start and end time of the task. The hover block will include a label like Maximum Time Between Revisits: 7 days, 14:12:00.
- Mean: Calculated as the average estimated time elapsed between distinct acquisition times of forecasted scenes for all revisits between the start and end time of the task. The hover block will include a label like Mean Time Between Revisits: 3 days, 22:36:00.
- Median: Calculated as the median estimated time elapsed between distinct acquisition times of forecasted scenes for all revisits between the start and end time of the task. The hover block will include a label like Median Time Between Revisits: 1 day, 14:18:00.
Creating and managing custom missions
Users may create and manage custom missions and custom instruments from the right-side Custom Missions panel in Acquisition Forecaster, Coincident Calculator, and Revisits Calculator tools. See the Custom Missions section for more information on creating and managing custom missions.
Creating and managing user created regions
Users may create and manage user defined regions from the right-side Regions panel in Acquisition Forecaster, Coincident Calculator, Coverage Analyzer, Revisits Calculator, and Data Browser tools. See the Regions section for more information on creating and managing regions.
Managing and loading completed tasks from task history
A task history may be accessed from the right-side menu tab in the Revisits Calculator tool. The task history is a list of Revisits Calculator tasks, and the list is limited to successfully completed tasks initiated during the current browser session for users not logged into a COVE user account or initiated while users are logged into a COVE user account. Each task description includes a title (mode - instrument - mission - region from start year-end year), mode selection (mission: mode-instrument-mission), date range (start date, end date), region selection for the task, and discretization details.
Revisits Calculator tasks are shown in a paginated list. Users may choose to display entries in the results list by 25, 50, 100, or 250 entries per page.
The search capability allows users to search for the sequence of characters in any of the parameters of the task history.
To load a task from the task history, click on the "Load this task" button located directly under the task details.
To delete a task from the task history, click on the red trashcan icon located directly under the task details.
Using output options
Users may select from the following output options:
- Download PNG: PNG (portable network graphics) is a common compressed raster graphics file format. PGN output images will contain the current map view.
- Open in Acquisition Forecaster: Push a task to the Acquisition Forecaster to allow users to visualize the forecasted acquisition footprints on the globe.