Help: User's Guide: Coverage Analyzer
Coverage Analyzer is a tool that provides users with the ability to analyze the historical satellite coverage of a region of interest. Coverage Analyzer generates a discretized area covering a region of interest, and it determines the coincidence of scenes within each discretized block. The coincidence of scenes is determined by the intersection of the footprint of the discretized block and the footprint of the scene. Scene data is extracted from satellite metadata imported into COVE from data providers for select satellite missions.
The missions included in Coverage Analyzer are Landsat 5 (Mar 1964: Jun 2013), Landsat 7 (Apr 1999: now), Landsat 8 (Feb 2013: now), Landsat 9 (Sep 2021: now), Sentinel-1A (Apr 2017: now), Sentinel-1B (Apr 2016: Aug 2022), Sentinel-2A (Jun 2015: now) and Sentinel-2B (Mar 2017: now). Sentinel-2A and Sentinel-2B are combined into one dataset from the data provider. Landsat 5, Landsat 7, Landsat 8, and Sentinel-2A & 2B datasets are imported from USGS's Earth Explorer API. Sentinel-1A and Sentinel-1B datasets are imported into COVE from an Alaska Satellite Facility (ASF) API. Other mission datasets may be added in the future.
Coverage Analyzer tool can be launched from the Tools menu in the title menu bar.
Initiating a task
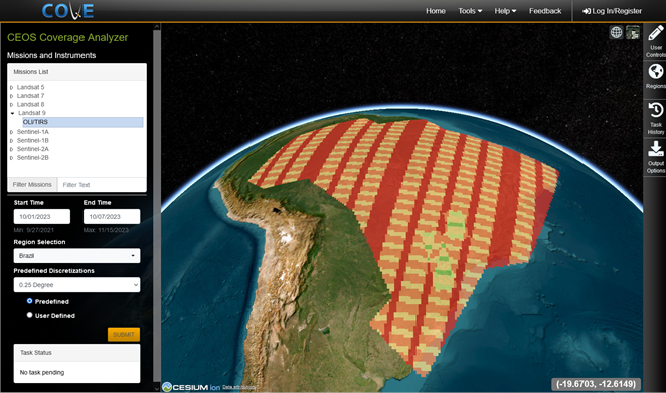
In Coverage Analyzer in the Missions and Instruments panel, users may choose from a small selection of missions. Users may click on a mission name to show the instrument modes available for the mission. Users may select one or more instrument modes from the missions list.
Missions available in Coverage Analyzer are limited to missions which have been integrated into COVE in an automated process to acquire datasets from satellite data providers. Scene data is submitted to data providers. The COVE automated acquisitions process runs daily and acquires all scene data submitted within the last thirty days for Sentinel-1 and Sentinel-2 missions and five days for all other missions.
Users may enter a start time and end time. The start time entered should be no earlier than the most recent satellite mission launch date of the mission/instrument modes selected in the missions tab. The minimum start date allowed will be displayed under the start time field once a mission/instrument mode has been selected. The end time entered should be no later than the current date for active missions or no later than the decommissioned date for inactive missions. The maximum end date allowed will be displayed under the end date field once a mission/instrument mode has been selected.
Users may select a region of interest from the region selection menu. Coverage Analyzer will zoom in to the region of interest on the map. Global region is only available for admin users.
Discretization is used to divide a region of interest into blocks. Users may select a discretization method: predefined or user defined discretization. Selecting the predefined discretization method will reveal a drop down of predefined discretization methods: Landsat WRS, S2 Tiling Scheme, 0.10 Degree, 0.25 Degree, 0.5 Degree, or 1 Degree. Landsat WRS is a tiling scheme mapped by path/row. S2 Tiling Scheme is mapped by granule. Selecting the user defined discretization method will reveal the discretization size and units fields. If users choose the Landsat WRS tiling scheme and a Landsat mission was selected, or if users choose the S2 Tiling Scheme and Sentinel-2A & 2B mission was selected, the option to include or not include overlap will appear in a drop down. If overlap is included, a scene may be included in multiple discretization blocks. If users choose user defined discretization, discretization size and units fields will appear. Users may enter a decimal value for discretization size with a minimum possible value of 0.1. Discretization unit may be set to degrees or kilometers. The discretization size is size of the square footprint if each block within the discretized region of interest.
Users may initiate a Coverage Analyzer task by selecting at least one instrument mode from the missions list, entering a start time and end time, selecting a region from the region selection menu, selecting a discretization method and details, and lastly selecting the Submit button.
Once a Coverage Analyzer task is initiated, the status of the task will be displayed in the Task Status block. The status will show "No task pending" if Coverage Analyzer is not currently waiting for the results of an initiated task. The status will show "Calculating coverage..." while validating user entered parameters and check for an excessively large discretization, and "Generating coincidence..." while the task is processing. Once the task has completed successfully, a heatmap of discretized blocks will be drawn on the map in the Coverage Analyzer tool.
Coverage Analyzer may return an error notifying the user that the task is too large. Coverage Analyzer estimates the number of discretized blocks in a region times the number of days in the date range to determine task size. If a task is too large, a user may choose to increase the discretization size, select a smaller region, or decrease the date range.
Once a task has been submitted in Coverage Analyzer, users may select the Cancel button while a task is running. Although be aware that even though the canceled task will not be listed in the Task History panel, the task will continue to run in the background where the data will be cached. If users choose to leave the Coverage Analyzer tool while a task is running without canceling the task, users may later load the results of the completed task from the Task History. If users wish to return to a task later, users should be logged in to their COVE user account prior to submitting the task or while loading the task from task history. Only tasks which completed without error will be listed in the Task History panel.
All tasks in the Task History in Coverage Analyzer are deleted from COVE after one week to clear cached data.
Viewing the results of a task
Results from Coverage Analyzer will appear in a heatmap of discretized blocks.
Hovering over a discretized block will show a title and the number of scenes (acquisitions) within the discretized block. The title varies depending on the discretization method chosen for the task. If the Landsat WRS discretization was chosen for the task, the title will appear like Title: path-row 5-15. If the S2 Tiling discretization was chosen for the task, the title will appear like Title: granule 18LWR. If a discretization size is specified for the discretization method, the title will appear like Title: Region Discretization Longitude -75.0, Latitude -8.5. If no scenes are found within the discretized block, no acquisition value will appear.
Clicking on a discretized block will trigger a popup window with a table of scenes available within the discretized block. The table will contain the columns: Scene ID, Acquisition Date, Mission Name, Order URL, Thumbnail URL, and Additional Metadata. Users may choose to display entries in the table by 25, 50, 100, or 250 entries per page. The search capability allows users to search for the sequence of characters in any of the columns of the table. Users may click on the "View in Data Browser" button to display the Coverage Analyzer task results in the Data Browser tool.
The Sentinel-2A & 2B mission is a combined dataset (SENTINEL_2A) from USGS's Earth Explorer API. The only way to distinguish Sentinel-2A scenes from Sentinel-2B scenes when viewing scene details in Coverage Analyzer is to look at the thumbnail URL. The thumbnail URL for Sentinel-2A will contain "s2a", and Sentinel-2B will contain "s2b". The order URL reflects the dataset name instead of the mission name.
Adjusting map results with user controls
User may choose to adjust the results on the map by changing user options available in the User Controls panel on the right side of the Coverage Analyzer tool.
Users may change the color of each range of images by:
- From the legend, clicking on the color block next to number range of images, and choosing a color from the colorpicker.
- Clicking on the pencil icon and changing the hex color code. Users may also adjust the maximum range of the number of images assigned to each color. Click the Validate Color Scale button to return to the legend and apply the color change.
- Changing the number of colors used in the color scale. Users may choose from a drop-down list of values ranging from three to nine.
- Changing the color scale from the drop-down menu. A limited number of color scales are available. Yellow to red, yellow to green, red to green, blue to green, and spectral. The default color scale is red to green.
Users may change the transparency of the heatmap by changing the transparency value. In Coverage Analyzer, transparency defaults to 0.01. The valid range for transparency is 0.01 to 0.99.
Users may choose to adjust the query results by changing filter options available in the User Controls panel on the right side of the Coverage Analyzer tool. Filter options in user controls will vary depending on the missions selected for the task currently loaded into results. A new Coverage Analyzer task is submitted once users select the "Submit" button to apply the filter options to the original task results. Task details in the Task History will also include any filter options applied. Filter options for each mission are:
-
Landsat (5, 7, 8, 9)
- Cloud cover percentage: Maximum cloud cover percentage allowed in a scene
- Landsat day or night indicator: Options include any, day, and night (scene lighting)
-
Sentinel-1A/1B
- Sentinel1 ascending or descending: Options include any, ascending, and descending (orbit direction)
- Sentinel1 processing level: Options include all, GRD (Ground Range Detected), and SLC (Single Look Complex).
-
Sentinel-2A/2B
- Cloud cover percentage: Maximum cloud cover percentage allowed in a scene
Creating and managing user created regions
Users may create and manage user defined regions from the right-side Regions panel in Acquisition Forecaster, Coincident Calculator, Coverage Analyzer, Revisits Calculator, and Data Browser tools. See the Regions section for more information on creating and managing regions.
Managing and loading completed tasks from task history
A task history may be accessed from the right-side menu tab in the Coverage Analyzer tool. The task history is list of Coverage Analyzer tasks, and the list is limited to successfully completed tasks initiated during the current browser session for users not logged into a COVE user account, or initiated while users are logged into a COVE user account. Each task description includes a title (mode - instrument - mission - region from start year-end year), mode selection (mission: mode-instrument-mission), date range (start date, end date), region selection for the task, and discretization details.
Coverage Analyzer tasks are shown in a paginated list. Users may choose to display entries in the results list by 25, 50, 100, or 250 entries per page.
The search capability allows users to search for the sequence of characters in any of the parameters of the task history.
To load a task from the task history, click on the "Load this task" button located directly under the task details.
To delete a task from the task history, click on the red trashcan icon located directly under the task details.
Using output options
The coverage map can be exported and downloaded using the options listed below. Supported formats include PNG, CSV, GEOTIFF, and NetCDF.
- Download PNG: PNG (portable network graphics) is a common compressed raster graphics file format. PGN output images will contain the current map view.
- Download CSV: CSV (comma separated values) is a common standard spreadsheet format. Output CSV files contain headers and a list of all unique scenes. This will remove any duplicate or overlapping coverages, providing a single list of all acquisitions from this task. CSV columns may include mission, name, acquisition_date, browse_url, order_url, start_time, stop_time, center_latitude, center_longitude, orbit_direction, path, frame, orbit_number, processing_level, row, day_or_night, cloud_cover, sensor, sun_elevation, sun_azimuth, granule_name, and scene_coords.
- Download GEOTIFF: GeoTIFF is a public domain metadata standard which allows georeferencing information to be embedded within a TIFF file. GeoTIFF raster data outputs which contains a georeferenced map of the acquisition count for your task. For degree- or kilometer-based tasks, the points will be the upper left of the discretization. For WRS based tasks, your task will be resampled to a 2-degree square and displayed as a normal square discretization.
- Download NETCDF: NetCDF (Network Common Data Form) is a machine independent data format developed by University Corporation for Atmospheric Research and allows for the sharing of array-oriented scientific data. NetCDF raster data outputs which contains a georeferenced map of the acquisition count for your task. For degree- or kilometer-based tasks, the points will be the upper left of the discretization. For WRS based tasks, your task will be resampled to a 2-degree square and displayed as a normal square discretization.
- Open in Data Browser: Push a task to the Data Browser to allow users to see the acquisition footprint on the globe and inspect thumbnail images.